
 Stormglass Report
 Extreme hedge fund shorting (2nd-highest since 2016) + collapsing futures liquidity ($5.1M top-of-book) = maximum pain is up, not down. Call options are cheap because everyone is positioned for a crash that isn't coming yet.
NQ rallies from ~24,000 to 35,000-40,000 over the next 9-18 months in a liquidity-driven, AI-narrative-fueled blow-off top. Followed by a major multi-year correction once retail is fully in.
Weekly close below the 200-week moving average (~19,500). Sustained Iran escalation without resolution. Fed pivots to aggressive hiking.
🧭 The core argument
Markets don’t crash when everyone expects them to crash. They crash when no one expects it.
Right now, everyone expects a crash. Hedge fund short positions in US-listed ETFs surged +10% on March 12 — the second-largest single-day increase in Goldman Sachs prime book data going back to 2016. The only bigger day was April 2nd, 2025 (“Liberation Day”). S&P futures liquidity has collapsed to $5.1 million top-of-book, down -80% since the start of the year and -61% below the historical average. This is near the lowest level since Liberation Day.
The thesis: NQ is in the compression phase before a final parabolic move higher. The fear is event-driven (Iran/oil shock), not structural. The macro backdrop — while fragile — remains constructive enough to support one more major leg up before the cycle truly ends.
🏗️ Three pillars
1. 🩳 Maximum pain is up
When positioning is this extreme, the market’s job is to inflict maximum damage — and that means going against the crowd. The crowd is short.
- Goldman prime book: hedge fund short positioning at near-record levels
- S&P futures liquidity at $5.1M — it takes just a few million dollars to move the index one tick
- Low liquidity amplifies moves in both directions, but with this much short fuel, the path of maximum pain is a violent squeeze higher
- The market rarely rewards the consensus trade, and right now consensus is bearish
2. 🚀 The liquidity engine: rates, AI, and political will
The why has multiple reinforcing drivers:
Trump’s midterm imperative and the Warsh appointment
The 2026 midterms are the single most important political event on the horizon. A sitting president with markets down going into midterms loses seats. Trump knows this — and he’s already made his move.
On January 30, 2026, Trump nominated Kevin Warsh to replace Jerome Powell as Fed Chair. Powell’s term ends May 15, 2026. Warsh is a former Fed governor (2006-2011, youngest ever appointed at 35), currently at the Hoover Institution and Stanford GSB.
Why Warsh matters for this thesis: Warsh is historically an inflation hawk — during the 2008-09 crisis he was more worried about inflation than unemployment. But he has recently shifted dovish in a way that directly supports the melt-up thesis:
- He has argued that AI is “profoundly” changing innovation speed, allowing the US to grow faster than other advanced economies — and that this enables policymakers to lower rates without sparking inflation
- He’s proposed a “QT-for-cuts” framework: shrink the Fed balance sheet aggressively to free up room for rate cuts. Lower short-term rates balanced by a smaller Fed footprint in the bond market
- Forecasters (CICC and others) expect Warsh may accelerate rate cuts in H2 2026, though his approach is “confirm first, act later” rather than preemptive easing
Net assessment: The incentive (Trump needs markets up) and the mechanism (Warsh’s AI-dovish, QT-for-cuts framework) are now both visible. The uncertainty is execution — specifically, Senate confirmation. This is a known risk, not a known unknown.
AI narrative acceleration
The AI investment cycle is not over. We are still in the infrastructure/capex phase — hyperscalers are spending hundreds of billions on compute. The narrative shift from “AI costs money” to “AI generates revenue” hasn’t fully happened yet. When it does — when the first wave of genuine AI productivity gains hits corporate earnings — the market will re-rate higher.
Whether the gains are real or perceived doesn’t matter for the melt-up. What matters is that the story is powerful enough to pull in the last wave of buyers.
The AI IPO wave as retail accelerant
OpenAI and Anthropic are both reportedly preparing for IPOs in 2026 (per Brad Gerstner on the All-In Podcast, March 13, 2026). If the two most hyped AI companies go public in the same year, this becomes the single most powerful retail magnet since the 2021 SPAC/meme era.
The sequence
Iran fear subsides → oil drops → inflation cools → Fed gets room to cut → AI narrative provides the “why” → rate cuts provide the fuel → retail FOMO provides the final push → blow-off top.
3. 🇯🇵 The Nikkei analog (structural pattern)
The Nasdaq’s current price structure rhymes with the Nikkei 225 in 1987-1989:
- A long secular bull market (decades of compounding gains)
- A sharp crash and recovery (Covid crash / Liberation Day ≈ Black Monday 1987)
- A multi-month compression with Bollinger Bands squeezing price into a tight range
- Then: a parabolic breakout from October 1988 to the December 1989 top — roughly +85% in 14 months
The NQ equivalent: +67% from ~24,000 to 40,000 over 9-18 months.
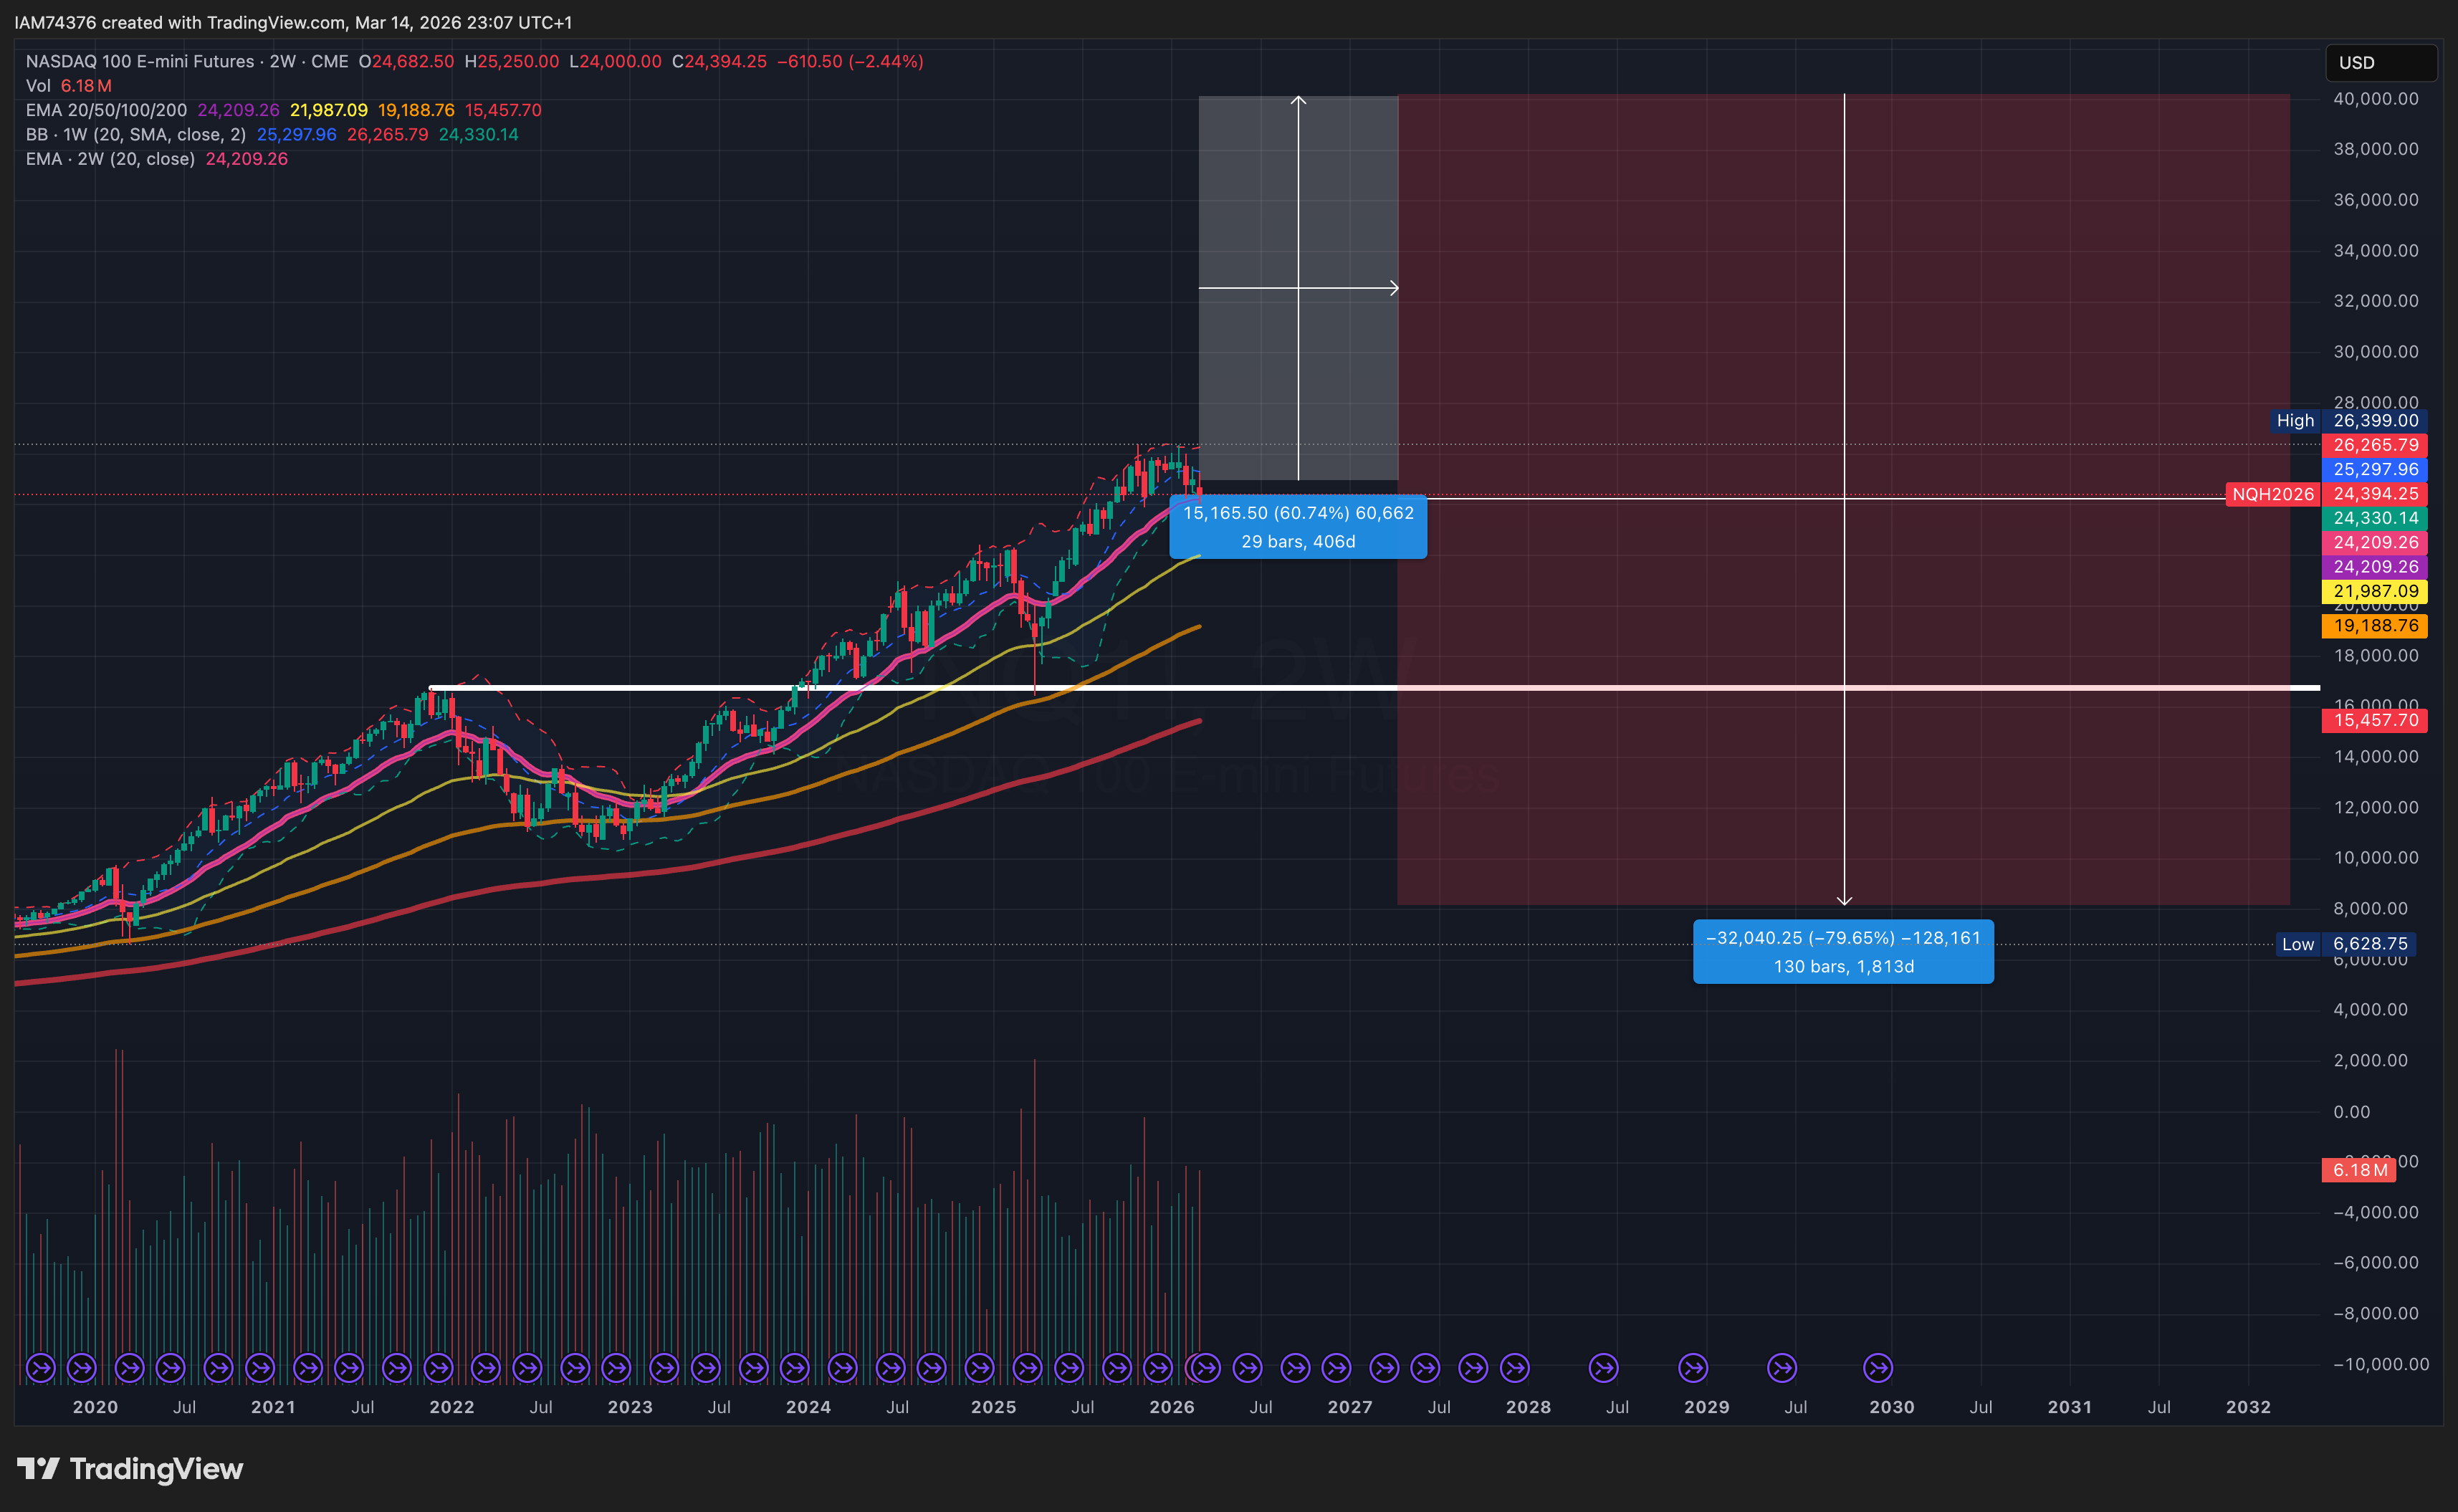
What the analog implies for the crash: The Nikkei topped at ~39,000 in December 1989 and didn’t bottom until ~7,600 in 2003 — roughly -80% over ~7,000 days. This thesis does not predict an identical outcome for the Nasdaq. But it suggests that blow-off tops built on leverage, narrative, and loose policy tend to correct hard — and the correction can last far longer than anyone expects.
💥 The crash — Phase 2
Conditions, not prediction.
The second half of this thesis is deliberately less defined. The melt-up is the actionable trade. The crash is the framework for knowing when to get out.
Why a major correction is likely after the top
-
Someone has to hold the bag. Blow-off tops end when the last wave of buyers — retail — is fully in. Professionals distribute to retail on the way up. When there are no more buyers, the market reverses. This is the mechanics of every bubble: tulips, railroads, dotcom, housing.
-
AI overinvestment. Hundreds of billions in AI capex requires revenue to justify. If the productivity thesis takes longer to materialize — or if returns concentrate in a few winners while most companies overspend — the gap between investment and return becomes a write-down event.
-
Private equity stress — this is already happening, not hypothetical.
- Dollar and fiscal stress. US government debt at all-time highs. The deficit is structurally unsustainable. This may not cause the crash, but it limits the policy response to the crash.
What I don’t know yet
- The exact trigger (PE blowup? AI earnings miss? credit event? sovereign debt scare?)
- The magnitude (-40%? -60%? -80%?)
- The duration (2 years? 10 years?)
- Whether this is a US-specific event or a global deleveraging
What I do know: After a melt-up driven by leverage, narrative, and political accommodation, the correction will be larger than most expect. The bigger the euphoria, the harder the fall.
🚪 Retail as the exit signal
The melt-up is only over when retail is fully committed. Signs to watch:
- Record retail brokerage account openings (Robinhood, Schwab, IBKR data)
- OpenAI / Anthropic IPOs land and get massively oversubscribed
- Meme stock resurgence and social media trading mania
- Crypto euphoria spilling into equities
- Mainstream media: fear → greed (“this time is different” headlines)
- The barber, the taxi driver, the family dinner conversations about stocks
- Put/call ratio collapsing as everyone buys calls and no one hedges
🚫 What invalidates this thesis
| Signal | Action |
|---|---|
| NQ weekly close below 200-week MA (~19,500) | Thesis dead. Full stop. |
| Iran war escalates with no resolution in sight | Sustained inflationary pressure. Reduces conviction. |
| Fed pivots to aggressive hiking (not just holding) | Liquidity engine breaks. Close longs. |
| 2Y-10Y yield spread inverts for 5+ consecutive closes | Recession signal. Reassess entirely. |
| Trump loses political will or ability to influence rates | Removes a key pillar. Downgrade conviction. |
⚠️ What I’m NOT saying
- I’m not saying the economy is healthy. It’s fragile.
- I’m not saying AI will deliver on its promises. It might not.
- I’m not saying the dollar is fine. It’s under structural pressure.
- I’m not saying this rally will be justified. Melt-ups are often unjustified — that’s what makes them melt-ups and not bull markets.
The thesis is that the market can be simultaneously fragile AND go up — because enough short-term forces (positioning, political will, narrative) push it higher before the structural problems catch up. The structural problems don’t disappear. They just don’t matter yet.
- Trump/rates mechanism is a known unknown — the incentive is clear but the execution path is uncertain
- Iran escalation could override all bullish signals if oil stays elevated and inflation reaccelerates
- The Nikkei analog is pattern-based, not fundamentally derived — patterns can fail
- Timing risk: the melt-up could take longer than 18 months, eroding options positions
- The crash thesis is underdeveloped — magnitude, trigger, and timing are all TBD
- Correlation risk: NQ, BTC, and risk assets may all move together in a stress event
- Low liquidity amplifies moves in both directions — the squeeze can reverse violently
🧮 Valuation math: what does NQ at 40,000 imply?
As of March 13, 2026, the market-cap-weighted TTM P/E of the top Nasdaq 100 holdings:
| Stock | Market Cap | TTM P/E |
|---|---|---|
| NVDA | $4.38T | 36.5x |
| AAPL | $3.68T | 31.3x |
| GOOG | $3.65T | 27.6x |
| MSFT | $2.94T | 24.6x |
| AMZN | $2.23T | 28.6x |
| META | $1.55T | 25.6x |
| TSLA | $1.47T | 333x (outlier) |
Weighted P/E of the top 6 (ex-TSLA, ~65% of index weight): ~30x. Full index including higher-multiple names: estimated 32-35x.
NQ at 40,000 = +64% from current levels. What P/E does that require?
| Earnings Growth (12-18mo) | Implied NQ 40K P/E | Historical Comparison |
|---|---|---|
| 0% (no growth) | 52-57x | Between Nikkei ‘89 and dotcom |
| +15% (moderate) | 45-50x | Nikkei 1989 peak range (~60-70x) |
| +20% (AI earnings kick in) | 43-47x | Elevated but below major bubble peaks |
🔬 Open questions
To develop further:
-
Warsh confirmation timeline: Tillis blockade could delay or derail Warsh’s confirmation. What happens if there’s no confirmed Fed chair by May 15? Who becomes acting chair? Does that change the rate path?
-
PE contagion modeling: The data confirms PE stress is real. Next step: map which public pension funds and insurers have the largest PE/private credit exposure — these are the forced sellers in a crisis.
-
Dollar/fiscal thesis: Is this the structural backdrop to the crash, or a separate multi-decade thesis? Probably the latter — worth a separate research note.
-
Dotcom comparison: The dotcom bust was -78% on the Nasdaq. What’s different this time? More diversified index (AAPL, MSFT, GOOG aren’t going to zero). Could argue the floor is higher but the drawdown is still significant.
-
Forward earnings estimates: Pull analyst consensus for NQ top holdings’ 2027 EPS to pressure-test the “15-20% earnings growth” assumption.